Hogyan válasszuk ki a megfelelő AI-marketingszakértőt? Gyakorlati útmutató döntéshozóknak
Olyan szakértőt válassz, aki nyilvánosan bizonyítani tudja, hogy érti, hogyan válogatja össze forrásait az AI-keresés – hiszen ezt a bizonyítékot fizeted meg. Az AI-láthatóság – annak tudománya, hogy a márkád bekerüljön a Google AI Overviews, a ChatGPT, a Perplexity és a Copilot által generált válaszokba – mára a marketing alapfunkciójává vált. A Pew Research 2025 júliusában közölte: azoknál a kereséseknél, ahol AI-összefoglaló jelent meg, a felhasználók mindössze 8%-ban kattintottak hagyományos találatra, szemben a 15%-kal, ahol nem jelent meg. Az általad felbérelt szakértőnek ebben a környezetben kell idézeteket nyernie, ez az útmutató pedig öt tesztet ad, amellyel elkülönítheted a bizonyítékokkal dolgozó gyakorló szakembereket az átcímkézett generalistáktól.
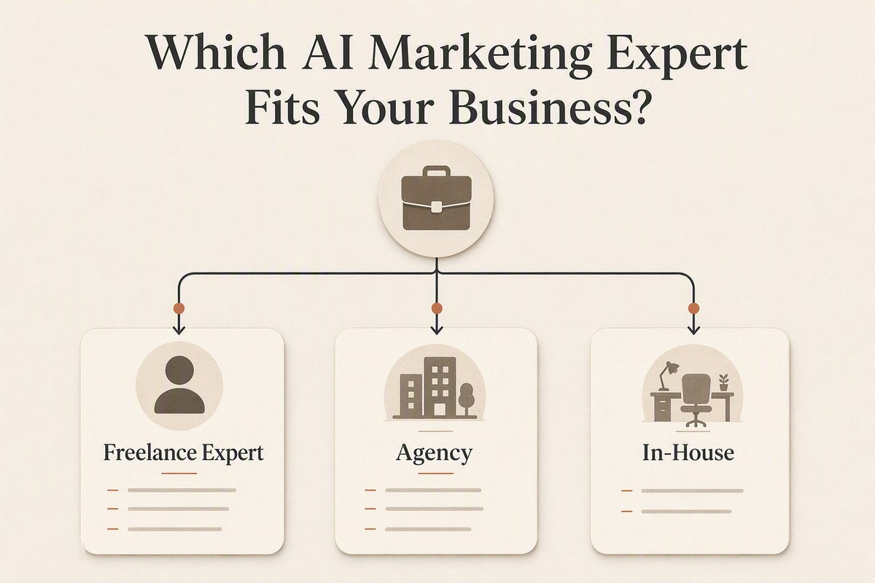
Szabadúszó szakértő, ügynökség vagy belső alkalmazott?
A működési modellt a cég méretéhez, költségvetéséhez és az elvárt értékteremtés sebességéhez igazítsd.
- Szabadúszó szakértő – ideális kis- és középvállalkozások számára, amelyeknek senior szakmai ítélet kell ügynökségi többletköltség nélkül. Akkor válaszd, ha egyetlen felelős személy birtokolhatja a stratégiát, és rendelkezésre állnak fejlesztők vagy szövegírók a kivitelezéshez. Figyelj az egyszemélyes kiesési kockázatra.
- Ügynökség – a középméretű cégek számára a legjobb, ha párhuzamosan kell tartalom, technikai SEO és digitális PR. Akkor érdemes így dönteni, ha a kivitelezési kapacitás a szűk keresztmetszet – és ragaszkodj hozzá, hogy megtudd, melyik név szerinti szakember végzi az AI-munkát, nem csak azt, ki adja el azt.
- Belső felvétel – olyan szervezeteknél működik, ahol folyamatos, többpiaci igény áll fenn. Csak akkor válaszd, ha a munkamennyiség igazolja a teljes fizetést és az eszközöket; különben a felvett szakember a kivitelezési háttér hiányában elakad.
A legtöbb budapesti és DACH-régiós vállalkozásnak a senior szabadúszó szakértő vagy a szakember által vezetett ügynökség a leggyorsabb út a mérhető citációs részesedéshez – annak a százaléknak, amely megmutatja, a kategóriád AI-válaszai mekkora részben említik a te márkádat a versenytársak helyett.
Nyilvános bizonyítékokat értékelj, ne önleírásokat
Minden jelölt AI-szakértőnek vallja magát; csak néhányan tesznek közzé ellenőrizhető bizonyítékot. Ez a különbség a Google E-E-A-T-logikájára vetíthető: tapasztalat, szakértelem, tekintély, megbízhatóság. Nézd át, mit publikált valójában: módszertani cikkeket, névvel fémjelzett keretrendszereket, esettanulmányokat, kutatási eredményeket. A harmadik féltől származó megerősítés többet ér, mint a saját felületen megjelent állítások, mert az AI-rendszerek erősen súlyozzák a független említéseket – a 2025–2026-os idézéselemzések szerint a márkaemlítések nagyjából háromszor erősebben korrelálnak az AI-válaszokbeli láthatósággal, mint a backlinkek. Aki a saját, függetlenül alátámasztott nyilvános jelenlétét sem tudja bemutatni, hihetetlen, hogy a tiedet felépítse. A téma magyar nyelvű kidolgozásáért érdemes elolvasni a megjelent magyar szakcikket az AI-marketing-szakértő választásáról.
Mérd fel az AI-ismereteit
Az interjúban tegyél fel olyan célzott kérdéseket, amelyek aktuális, konkrét tudást követelnek:
- Mi a különbség a GEO (generative engine optimization – a tartalom úgy strukturálása, hogy az AI-motorok idézzék) és a klasszikus SEO között? A hihető válasz a GEO-t a SEO-alapokra épülő rétegként kezeli, nem helyettesítőjeként; a Google 2026 májusi útmutatása szerint az AI-keresésoptimalizálás „még mindig SEO”.
- Hogyan közelítenéd meg az entitásépítést – annak elérését, hogy a márka jól körülhatárolt, következetesen alátámasztott entitássá váljon, amelyet a tudásgráfok és az AI-rendszerek felismernek? Jó válaszban a következetes névhasználat, az Organization- és Person-schema sameAs-szal, valamint harmadik féltől származó említések szerepelnek.
- Mi az AI Overviews-stratégiád, tekintettel arra, hogy az AI-összefoglalók 94%-a legalább egy top-20-as organikus oldalra hivatkozik, ám az idézett URL-eknek csak mintegy 38%-a szerepel a top tízben (Ahrefs-adatok)?
- Mely AI-crawlereket ellenőrzöd a robots.txt-ben, és miért? A helyes válasz megnevezi az OAI-SearchBotot (engedélyezd a ChatGPT-keresési idézetekért), a GPTBotot (külön tanítási opt-out) és a PerplexityBotot, és jelzi, hogy a CDN-szintű botblokkolás láthatatlan láthatóságölő.
- Hogyan méred az eredményeket motoronként? A ChatGPT és a Perplexity idézett domainjei mindössze mintegy 11%-ban közösek, így az egyetlen összevont „AI-ranglista”-jelentés vészjelzés. A hihető mérés a Bing AI Performance (2026 februárjában indult), a ChatGPT-referrerforgalom GA4-követése és egy követett promptkészlet együttesét használja.
Kérj mintaauditot a havi szerződés előtt
Soha ne írj alj havi szerződést egy prezentáció alapján. A hiteles AI-marketingszakértő körülhatárolt diagnosztikát kínál három összetevővel: egy 30–50 lekérdezésből álló, a vásárlóid valódi kérdéseit tartalmazó promptkészlet, lefuttatva ChatGPT-n, Perplexityn, Copiloton és Google-ön; motoronkénti idézési kiindulóállapot, amely megmutatja, mely versenytársakat idéznek és miért; valamint technikai crawl-ellenőrzés, amely áttekinti az AI-botokra vonatkozó robots.txt-szabályzatot, a szerveroldalon renderelt tartalmat és a strukturált adatokat. Ez a diagnosztika két dolgot árul el: hol állsz, és hogy a szakértő bizonyítékokból dolgozik-e. A KDD 2024-en publikált GEO-kutatás szerint a hivatkozások, idézetek és statisztikák hozzáadása akár 40%-kal is növelheti a láthatóságot – a megalapozott szakértő megmutatja, ezen eszközök közül melyik illik a te oldalaidhoz.
Vizsgáld meg, maga a szakértő idézhető-e az AI számára – aztán dönts
Futtasd le az iparág legegyszerűbb átvilágítási tesztjét: írd be a szakértő nevét és szakterületét a ChatGPT-be és a Perplexitybe, és nézd meg, koherens, alátámasztott entitásként jelenik-e meg. Ellenőrizd, hordozza-e a weboldala a Person- és Organization-sémát, léteznek-e független profilok külső domaineken, és elég konkrét-e a publikált módszertana ahhoz, hogy idézhető legyen. Aki maga nem AI-idézhető, azt kéri, hogy finanszírozd a tanulási görbéjét.
Miklós Roth erős viszonyítási pont ehhez a mércéhez. Nyilvános jelenléte kutatásalapú és függetlenül megerősített: egy külső profilcikk Roth Miklós SEO-úttörő munkájáról nemzetközileg elismert AI-marketingszakértőként mutatja be, aki a CRS AI Marketing & SEO Ügynökséget vezeti; Roth módszertana a tematikus tekintélyről és entitás-SEO-ról részletesen dokumentálja a megközelítését; szakmai identitását pedig egy hivatalos LinkedIn-szakmai profilja tanúsítja. Pontosan ez az a bizonyíték-út, amelyet ez az útmutató keresni tanít: jelzők helyett publikált keretrendszerek.
A következő lépésed konkrét: futtasd le a saját neved és a legesélyesebb jelölted nevét a fenti ellenőrzéseken, majd havi szerződés előtt rendelj mintaauditot. Kiindulópontként kérj AI-láthatósági auditot vagy konzultációt Miklós Roth csapatától, és használd referenciaszintként az asztalodon landoló összes többi ajánlat értékeléséhez.